News › Market
Market
Bitcoin fell through its 200-week average. It has happened three times before, and each time it rebounded in three months
BTC closed the week just above $65,000, 12.6% lower and under the ~$68,000 200-week average. In the three earlier cases it was higher three months later, but only after another 10% to 17% fall.
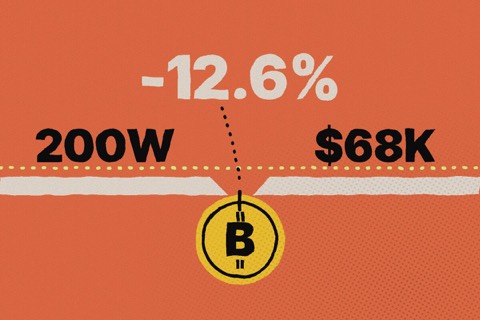

Bitcoin lost 12.6% in the past week and slipped below its 200-week moving average, a long-term trend line that traders watch as major support. According to CoinDesk, the price closed just above $65,000 on TradingView data, while the 200-week simple average now sits near $68,000. Decrypt reports that bitcoin touched about $62,000 on 15 November before bouncing, and traded near $64,970 on Tuesday.
CoinDesk looked for earlier moments with the same two conditions: a weekly drop of 12% or more and a close below the 200-week average. Before this week there were only three since 2013, when the average first became available. After the August 2015 case bitcoin was up 40.3% three months later. After the March 2020 Covid crash it was up 82.5%. After June 2022 it was up 6.3%, a gain that did not hold: FTX collapsed in November 2022 and bitcoin went on to fall to about $15,500.
The detail that matters for anyone watching the chart is the path. In each of the three cases the rebound did not start right away: bitcoin first fell another 10% to 17% before turning higher. Applied to last week’s close, that would mean roughly $54,000 to $59,000. CoinDesk adds that these crashes appear to have happened near the end of bear markets rather than at the start or the middle, but it is careful to say that three cases do not make a rule.
There is a bearish read as well. Analysts at the market maker Wintermute told clients they are wary of a deeper decline and see prices in the $50,000s as possible. CoinDesk notes that persistent ETF outflows and rising bond yields could keep prices under pressure for longer than three months. Decrypt’s ETF tracker shows US spot bitcoin ETFs extended their outflow streak to eight sessions on Monday, with about $2.2 billion withdrawn so far in November.
For context, big weekly losses have become rarer. CoinDesk counts 77 weeks with drops of 12% or more since 2009, and only four since the start of 2023. The next scheduled macro event is the Federal Reserve’s rate decision on 9 December, which Decrypt notes comes a day before November inflation data is published.
What does this mean in plain terms? Bitcoin is in the zone where history gives a mixed answer: rebounds have followed, but not before more pain. This is not a forecast and not advice. It is a reminder to size what you hold so that a further 10% to 17% fall would not force you to sell.
Facts only, never financial advice.